Why Python for SEO
Search Engine Optimization is a dynamic field where staying competitive is key. In recent years, a powerful ally has emerged for SEO professionals: Python. This versatile programming language is quickly becoming a must-have tool in the SEO toolkit. But why is Python gaining such traction in the SEO community?
Python’s relevance in SEO stems from its ability to automate and scale various SEO tasks. From data analysis to web scraping, Python empowers SEO experts to handle large datasets, perform complex calculations, and streamline repetitive tasks with ease.
It’s like having a Swiss Army knife for digital marketing – adaptable, reliable, and incredibly useful for a wide range of SEO challenges. From analyzing website performance to automating tedious tasks, Python is helping SEO professionals work smarter, not harder.
- Automation of Repetitive Tasks: Python scripts can automate time-consuming tasks like keyword research, content analysis, and backlink audits, freeing up valuable time for strategy and creative thinking.
- Data Analysis at Scale: With libraries like pandas, SEO professionals can analyze vast amounts of data quickly, uncovering insights that would be impractical to find manually.
- Web Scraping Capabilities: Python’s libraries such as BeautifulSoup and Scrapy make it easy to extract data from websites, which is crucial for competitor analysis and content research.
- API Integration: Many SEO tools and platforms offer APIs that can be easily accessed using Python, allowing for custom reporting and data integration.
- Customizable Solutions: Python’s flexibility allows SEO professionals to create tailored solutions for unique problems, going beyond the limitations of off-the-shelf SEO tools.
By leveraging Python, SEO professionals can not only improve their efficiency but also gain deeper insights into their data, leading to more informed strategies and better results.
Getting Started with Python for SEO
Introduction to Jupyter Notebooks
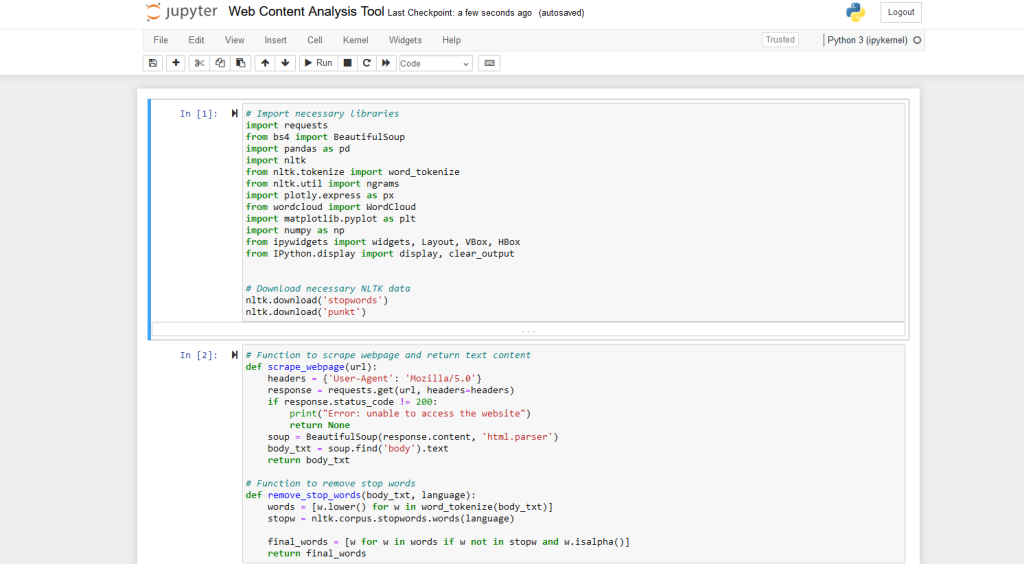
One of the best ways to start using Python for SEO is through Jupyter Notebooks. Jupyter Notebooks provide an interactive environment where you can write and execute Python code, visualize data, and document your process all in one place.
Key features of Jupyter Notebooks for SEO work:
- Interactive Coding: Execute code cells individually, allowing for step-by-step analysis and easy debugging. (this is very important for a beginner as it helps you to understand the logic step by step)
- Rich Media Output: Display charts, graphs, and tables directly in the notebook, making data visualization seamless.
- Markdown Support: Add explanations and notes using Markdown, creating self-documenting SEO analyses.
- Shareable Format: Easily share your work with team members or clients in a format that combines code, outputs, and explanations.
Setting up the Environment
Anaconda
Getting started with Python for SEO is easier than you might think, thanks to Anaconda. Anaconda is a free, open-source distribution of Python that comes pre-loaded with many of the libraries you’ll need for SEO work, including Jupyter Notebook. Here’s how to get set up:
- Download Anaconda: Visit the official Anaconda website and download the version appropriate for your operating system (Windows, macOS, or Linux).
- Install Anaconda: Run the installer and follow the prompts. The default settings are usually fine for most users.
- Launch Jupyter Notebook: After installation, you can launch Jupyter Notebook from the Anaconda Navigator or by typing
jupyter notebookin your command prompt or terminal.
That’s it! With Anaconda, you now have Python, Jupyter Notebook, and many essential libraries (like pandas and matplotlib) ready to go. This all-in-one solution saves you the hassle of installing Python and individual packages separately.
For SEO-specific libraries that might not be included in the default Anaconda distribution (like requests or beautifulsoup4), you can easily install them using Anaconda’s package manager. Just open your Anaconda prompt and type:
conda install requests beautifulsoup4
Or, if you prefer using pip:
pip install requests beautifulsoup4
With this setup, you’re ready to start your Python SEO journey without the headache of complex installations or compatibility issues. In the next section, we’ll explore some of the key Python libraries that will supercharge your SEO workflows.
Python Libraries Useful for SEO
Pandas
Pandas is the Swiss Army knife of data manipulation in Python. It provides data structures for efficiently storing large datasets and tools for working with structured data. For SEO, Pandas is invaluable for tasks like analyzing large keyword lists, processing CSV exports from various SEO tools, or manipulating data from Google Analytics. With Pandas, you can easily merge datasets, filter data, perform calculations across columns, and create pivot tables. Its ability to handle large datasets makes it perfect for working with the volume of data often encountered in SEO tasks.
Requests
The Requests library is your gateway to interacting with web services and APIs. It simplifies the process of sending HTTP/1.1 requests, which is essential for tasks like fetching web pages for analysis or interacting with SEO tool APIs. With Requests, you can easily retrieve the HTML of a webpage, check status codes, or send data to APIs. This library is often the starting point for web scraping tasks and is crucial for automating interactions with various web services used in SEO.
BeautifulSoup
BeautifulSoup is a library for pulling data out of HTML and XML files. It works with your favorite parser to provide idiomatic ways of navigating, searching, and modifying the parse tree. For SEO, BeautifulSoup is incredibly useful for tasks like extracting specific elements from webpages (e.g., title tags, meta descriptions, headings), analyzing on-page SEO factors, or scraping competitor websites. When combined with Requests, BeautifulSoup becomes a powerful tool for automating the collection of web data relevant to SEO analysis.
Advertools
Advertools is a library specifically designed for digital marketers and SEO professionals. It provides a wide range of functions for various SEO tasks, including keyword generation, text analysis, and crawling websites. With Advertools, you can easily generate keyword combinations, analyze search engine results pages (SERPs), extract structured data from webpages, and even create SEO reports. Its SEO-focused functions make it a valuable addition to any Python-savvy SEO professional’s toolkit.
Plotly
Data visualization is crucial in SEO for understanding trends and communicating insights. Plotly is a library that creates beautiful, interactive visualizations. With Plotly, you can create a wide range of charts and graphs, from simple line charts to complex heatmaps. For SEO, this is particularly useful for visualizing keyword trends, backlink profiles, or website traffic patterns. The interactive nature of Plotly visualizations makes them excellent for client presentations or team dashboards.
NLTK (Natural Language Toolkit)
The Natural Language Toolkit (NLTK) is a leading platform for building Python programs to work with human language data. In SEO, NLTK can be used for advanced content analysis tasks. It provides tools for tokenization, stemming, tagging, parsing, and semantic reasoning. This makes it valuable for tasks like analyzing the readability of content, extracting key phrases from large bodies of text, or even developing more sophisticated content optimization tools. While it has a steeper learning curve than some other libraries, NLTK opens up possibilities for advanced natural language processing in SEO.
Streamlit
While not strictly an SEO tool, Streamlit is incredibly useful for quickly creating web apps for data science and machine learning projects. For SEO professionals using Python, Streamlit provides an easy way to turn data scripts into shareable web apps. This can be particularly useful for creating interactive dashboards for SEO data, building tools for team members who may not be comfortable with Python, or presenting interactive reports to clients. With Streamlit, you can transform your Python SEO scripts into user-friendly applications with minimal additional code.
Each of these libraries brings unique capabilities to your Python SEO toolkit. By combining them, you can create powerful, custom solutions for a wide range of SEO tasks, from data collection and analysis to visualization and reporting. In the next section, we’ll put some of these libraries to use in a practical example, demonstrating how Python can solve real-world SEO challenges.
Web Content Analysis Tool
Let’s dive into a practical example in Jupyter Notebook that demonstrates how we can use Python libraries to create a web content analysis tool. This tool can be useful to analyze the content of web pages, identify frequently used keywords and phrases, and visualize the results.
This tool will:
- Scrape the content of a given webpage
- Process the text to remove common words (stop words)
- Analyze the frequency of individual words, two-word phrases (bigrams), and three-word phrases (trigrams)
- Display the results in easy-to-read tables
- Visualize the data with a word cloud and interactive treemaps
This script will demonstrate basic web scraping, text processing, data analysis, and visualization techniques using popular Python libraries like requests, BeautifulSoup, NLTK, pandas, and Plotly.
Setting Up the Environment
First, we import the necessary libraries: (copy and paste each of these sections into different Notebook cells)
					import requests
from bs4 import BeautifulSoup
import pandas as pd
import nltk
from nltk.tokenize import word_tokenize
from nltk.util import ngrams
import plotly.express as px
from wordcloud import WordCloud
import matplotlib.pyplot as plt
import numpy as np
from ipywidgets import widgets, Layout, VBox, HBox
from IPython.display import display, clear_output
					nltk.download('stopwords')
nltk.download('punkt')
Here’s what each library does:
requests: For making HTTP requests to web pagesBeautifulSoup: For parsing HTML contentpandas: For data manipulation and analysisnltk: For natural language processing tasksplotly.express: For creating interactive visualizationsWordCloud: For generating word cloudsmatplotlib: For creating static visualizationsipywidgets: For creating interactive UI elements in Jupyter notebooks
We also download necessary NLTK data.
Core Functions
					# Function to scrape webpage and return text content
def scrape_webpage(url):
    headers = {'User-Agent': 'Mozilla/5.0'}
    response = requests.get(url, headers=headers)
    if response.status_code != 200:
        print("Error: unable to access the website")
        return None
    soup = BeautifulSoup(response.content, 'html.parser')
    body_txt = soup.find('body').text
    return body_txt

# Function to remove stop words
def remove_stop_words(body_txt, language):
    words = [w.lower() for w in word_tokenize(body_txt)]
    stopw = nltk.corpus.stopwords.words(language)

    final_words = [w for w in words if w not in stopw and w.isalpha()]
    return final_words
The script defines two main functions:
scrape_webpage(url): This function takes a URL as input, sends a request to the webpage, and returns the text content of the body. It uses a custom User-Agent to mimic a browser request.remove_stop_words(body_txt, language): This function tokenizes the text, removes stop words (common words like “the”, “is”, etc.), and returns a list of significant words. It supports multiple languages.
User Interface
					# Widgets for user input
url_input = widgets.Text(
    value='',
    placeholder='Enter URL',
    description='URL:',
    layout=Layout(width='50%')
)

language_input = widgets.Dropdown(
    options=['english', 'italian', 'albanian'],
    value='english',
    description='Language:',
    layout=Layout(width='50%')
)

num_results_input = widgets.IntSlider(
    value=50,
    min=10,
    max=150,
    step=10,
    description='Results:',
    layout=Layout(width='50%')
)

analyze_button = widgets.Button(
    description='Analyze',
    button_style='primary',
    layout=Layout(width='30%')
)

output_area = widgets.Output()

# Function to handle button click
def on_analyze_button_clicked(b):
    with output_area:
        clear_output()
        url = url_input.value
        language = language_input.value
        n = num_results_input.value

        if not url:
            print("Insert a URL")
            return

        body_txt = scrape_webpage(url)
        if not body_txt:
            return

        final_words = remove_stop_words(body_txt, language)

        # Store results in global variables
        global df1, df2, df3, all_final_words, all_body_txt
        all_final_words = final_words
        all_body_txt = body_txt

        # Bigrams
        bigrams = ngrams(final_words, 2)
        freq_bigrams = nltk.FreqDist(bigrams)
        bigrams_freq = freq_bigrams.most_common(n)

        # Keyword frequency
        freq = nltk.FreqDist(final_words)
        keywords = freq.most_common(n)

        # ngrams = 3
        ngrams3 = ngrams(final_words, 3)
        freq_ngrams3 = nltk.FreqDist(ngrams3)
        ngrams3_freq = freq_ngrams3.most_common(n)

        # Creating pandas dataframes
        df1 = pd.DataFrame(keywords, columns=("Keyword", "Frequency"))
        df2 = pd.DataFrame(bigrams_freq, columns=("Bigram", "Frequency"))
        df3 = pd.DataFrame(ngrams3_freq, columns=("Ngrams3", "Frequency"))

        print("Data scraped and processed. You can now execute the subsequent cells to see the results.")

# Attach event handler to the button
analyze_button.on_click(on_analyze_button_clicked)

# Display the UI
ui = VBox([HBox([url_input, language_input]), num_results_input, HBox([analyze_button]), output_area])
display(ui)
The script creates an interactive user interface using ipywidgets. Users can input:
- URL of the webpage to analyze
- Language of the content
- Number of results to display
A “Analyze” button triggers the analysis process.
Analysis Process
When the user clicks “Analyze”, the script:
- Scrapes the webpage
- Removes stop words
- Generates frequency distributions for:
- Individual keywords
- Bigrams (two-word phrases)
- Trigrams (three-word phrases)
- Creates pandas DataFrames with the results
Visualizations
					# Display keyword frequency
display(df1)
					# Treemap graph for Keywords
fig = px.treemap(df1[:30], path=[px.Constant("Key Frequency"), "Keyword"],
                 values='Frequency', color='Frequency',
                 color_continuous_scale='viridis',
                 color_continuous_midpoint=np.average(df1['Frequency']))
fig.update_layout(margin=dict(t=50, l=25, r=25, b=25))
fig.show()
					# Word Cloud
wordcloud = WordCloud(width=800, height=400, background_color='white').generate(' '.join(all_final_words))
plt.figure(figsize=(10, 6))
plt.imshow(wordcloud, interpolation='bilinear')
plt.axis('off')
plt.show()
					# Display Bigrams frequency
display(df2)
					# Treemap graph for Bigrams
fig = px.treemap(df2[:30], path=[px.Constant("Bigram Frequency"), "Bigram"],
                 values='Frequency', color='Frequency',
                 color_continuous_scale='viridis',
                 color_continuous_midpoint=np.average(df2['Frequency']))
fig.update_layout(margin=dict(t=50, l=25, r=25, b=25))
fig.show()
					# Display Ngrams=3 frequency
display(df3)
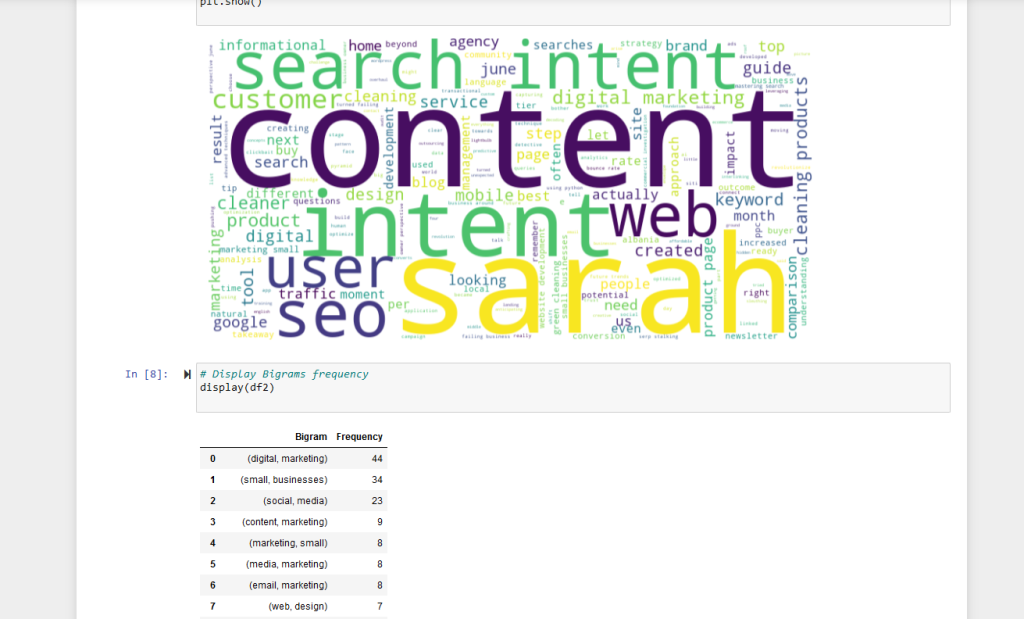
The notebook provides several visualizations of the analyzed data:
- Keyword Frequency Table: Displays the most common individual words and their frequencies.
- Treemap for Keywords: An interactive treemap visualization of the top 30 keywords, where the size and color of each box represent the frequency of the keyword.
- Word Cloud: A visual representation where the size of each word indicates its frequency in the text.
- Bigram Frequency Table: Shows the most common two-word phrases.
- Treemap for Bigrams: Similar to the keyword treemap, but for two-word phrases.
- Trigram Frequency Table: Displays the most common three-word phrases.
Learning SEO Concepts Through Python
This script serves as a starting point for those looking to learn Python for SEO. While it’s not a professional tool, it demonstrates several concepts that are valuable in SEO work:
- Basic Content Analysis: See how you can extract and analyze the main topics from a webpage.
- Introduction to Keyword Analysis: Learn how to identify commonly used words and phrases on a webpage.
- Data Visualization Practice: Experiment with creating simple visualizations of word frequencies.
- Web Scraping Basics: Understand the fundamentals of how to fetch and parse web content.
- Text Processing: Get hands-on experience with basic natural language processing techniques.
- Data Manipulation: Practice working with data using pandas DataFrames.
By experimenting with this script, you can start to understand how Python can be applied to SEO tasks. It’s a great way to get familiar with key libraries and concepts before moving on to more complex applications.
Remember, this is a learning tool, not a substitute for professional SEO analysis. As you grow more comfortable with Python, you can expand on these concepts to create more sophisticated and tailored tools for your SEO needs.
Read also: How to write effective prompts for LLMs
